The devil is in the details. Add custom metrics, analytics and SLA data to your status page. Tell the complete story and illustrate what you want to say with supportive data points.
Every business service has to perform to a standard. For your IT department or your SaaS application, these standards are usually defined by Service Level Agreements (SLAs). With StatusCast, you automatically keep track of the operational uptime for all your corporate assets or across every individual component and service.
StatusCast let’s you sense check to determine whether incidents you have created were the actual cause of downtime and should be factored into the uptime stats for the specific set of components that may have been affected.
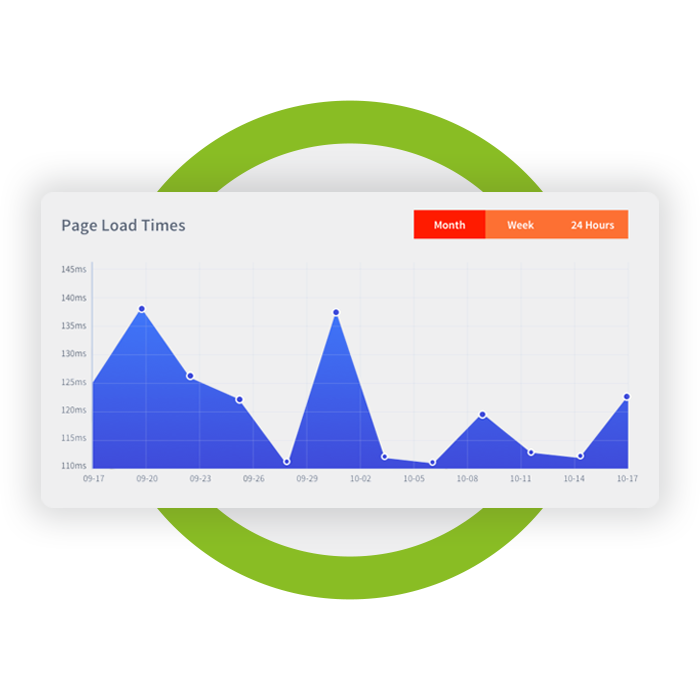
Sometimes your customers or employees want to see more than incident management updates. StatusCast lets you include historical metric information from a variety of sources. Show server response rates, page load times, and any other time based data you want.
The StatusCast API let’s you push whatever custom data from third party sources you may want to display on your status page charts. We also have direct integrations with your favorite uptime monitors and Application Performance Monitoring services. Tie directly to DataDog, New Relic and Pingdom accounts to display real time content on your status pages.. With just a few simple clicks you can be showing a live data feed on your status page.